🐿️ The Squirrelmobile - The Insanely Profitabe Tech Newsletter
Originally published 22nd April 2024
As a graduate student, I had the unenviable job of teaching “business calculus” at 8 AM to a group of sleepy and totally under-motivated undergraduates, future bankers and nurses forced to take maths for bureaucratic reasons none of us could fathom. To keep them awake, I told stories about driving in my Squirrelmobile, an imaginary car travelling on a long, straight road at varying speeds. We graphed my movements on the vertical axis and time on the horizontal, like this:
a horizontal line depicts me in a parking space, with no movement at all vertically:
a gentle slant indicates I’m driving slowly, moving a short distance (vertically) over a long time (horizontally) without speeding up or slowing down:
a steep incline means I’m in a drag race, moving a long way in a short time:
a U-shape shows me driving one way, slowing down to a stop at the apex, then reversing:
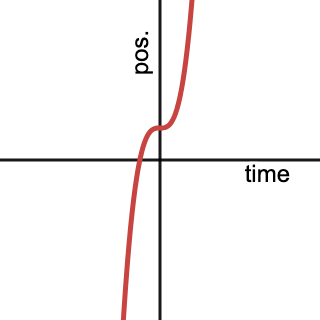
and this shows a California stop, where I slow down and pause briefly at the flat bit, before speeding off again in the same direction:
Thinking about how fast I was going and when I stopped led us naturally to try figuring out, just from the graph, what my speedometer would say at any given moment. My speed turns out to be the slope of the blue “tangent line” as illustrated below—it’s known to cognoscenti as the derivative, but normal humans just call it steepness.
I found that sketching motion graphs like this helped my students avoid silly mistakes, and it sure was fun “driving” around the classroom and having them graph me!
This all came flooding back when I was looking at very similar images used to illustrate gradient descent, the key process that makes machine learning work.
Here what’s “moving” isn’t the Squirrelmobile, but a computer program of a very special kind, a neural network, whose behaviour is dictated by billions or trillions of numbers called weights. This graph shows a cost function, with the value of just one of those weights along the horizontal axis, and a performance score along the vertical (like in golf or limbo, lower is better). The process of “training” a model like ChatGPT is nothing more than adjusting the weights in small increments so the performance of the program improves on known examples, calculating the steepness at each stage to see what further tweak will move you closer to a minimal level of error fastest. In other words, we’ve figured out how to get a machine to program itself by steering its “code” downhill to the best configuration. (Health warning: there are equations and formulas in some of these links, but they won’t bite, I promise.)
And then I realised that this kind of rapid convergence is exactly what I advise my clients to aim for when they’re building software products. First, decide on a way to measure what’s “better”, ideally with financial metrics like conversion rate, basket size, or order value. [You don’t need the precision of a “North Star” metric, just a constellation pointing you in the right general direction – see the forum for more.] Next, adjust your software in very frequent small steps, releasing daily if possible. Mark to market each incremental change, and aim to reduce the error (or equivalently, boost the gain) every time. One of my clients recently used this method to deliver a whole new user workflow right on time to huge accolades, while another blasted through an upgrade that was seven years overdue. What could you do if you had a GPS that told you which way success lay?
(Graphs from the excellent Desmos calculator.)
This first appeared in my weekly Insanely Profitable Tech Newsletter which is received as part of the Squirrel Squadron every Monday, and was originally posted on 22nd April 2024. To get my provocative thoughts and tips direct to your inbox first, sign up here: https://squirrelsquadron.com/


